The Fundamentals of Amplitude and Loudness
07/3/2018
Article Content
In working with sound it is essential to have a firm grasp of amplitude and loudness and the various methods of measurement. Key to this is understanding the decibel (dB). Most amplitude measurements use decibels in one form or another. The Decibel is a logarithmic unit that expresses value in relation to another value. In other words, decibels are relative as opposed to absolute units. More on decibels here.
Logarithmic Scales
Human hearing is best measured and represented with a logarithmic scale as opposed to a linear scale. Linear scales represent a change in values as a difference, whereas logarithmic scales represent changes as a ratio. This might best be understood in terms of our perception of frequency. Consider the layout of a parametric EQ seen below.
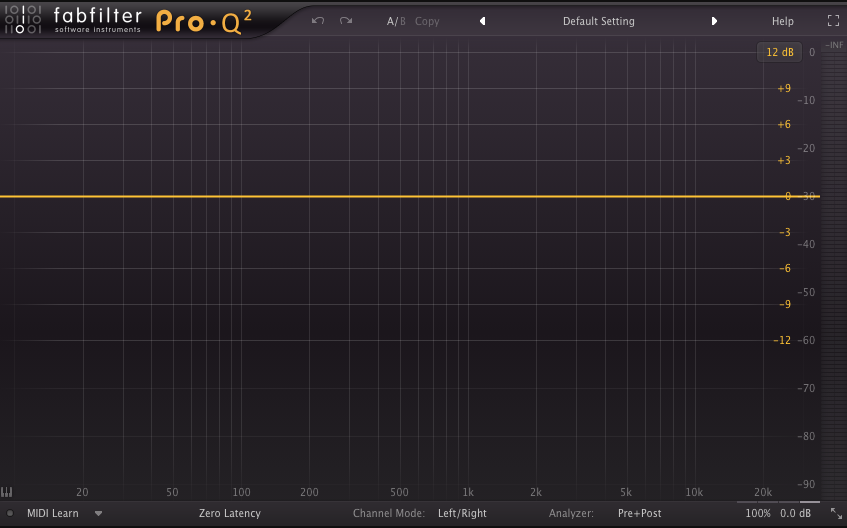
Note that the vertical lines represent frequency values that do not look equally spaced. For instance, from 100Hz to 200Hz is spaced farther apart than is 200Hz to 300Hz. This is a logarithmic scale based on powers of 10. Find more explanation of logarithms here. Although the numerical distance between 100Hz and 200Hz is the same as that between 200Hz and 300Hz, we do not hear that distance as the same. In fact, we hear the distance between 200Hz and 400Hz as the same, which is the interval of an octave or a doubling of frequency or a 2:1 ratio.
This human perception is best visualized using a logarithmic scale so the physical distance on the graph between various octaves (e.g. 100-200Hz, 200-400Hz, or 1000Hz-2000Hz) is the same. A linear scale would be far less intuitive in terms of frequency or amplitude.
Amplitude and Loudness
So decibels express amplitude or loudness levels as a value relative to some reference value or beginning value. For example, -12dBSPL by itself is meaningless. But if we compare it to some level we’ll call 0dBSPL, we can say that it is roughly half as loud. The levels commonly found on a track in a DAW are dBFS or Full Scale. 0dBFS is the absolute peak in a digital system after which samples will be clipped. Most people begin to hear a slight change in level at plus or minus 2dB to 3dB. A 6dB change is perceived as a significant change in level and 10dB to 12dB can be heard as a doubling or halving of loudness.
Having a good understanding of these ideas will speed up your mixing process substantially by fine-tuning your isomorphic mapping abilities. That is, your knowledge of what sonic effects will be created by a particular slider or knob before you make the adjustment. Otherwise, it’s just trial and error.
dBSPL refers to Sound Pressure Level and indicates a value relative to the Threshold of Human Hearing which is commonly believed to be 20 Micropascals (.000020 Pascals or 20 millionths of a Pascal). A Pascal (named after Blaise Pascal) is a unit of force equivalent to one Newton (named after Sir Isaac Newton) per square meter.
A Pascal is an absolute unit that can be measured. But saying that The Who concert in 1976 broke the world record for loudness at 126dBSPL at a distance of 105 feet from the stage is meaningless, unless you compare that to 0dBSPL at the same distance, which is the Threshold of Human Hearing. That is the quietest sound a human being with undamaged hearing can detect given a test tone of 1000Hz. This perceived level is subject to environmental issues like temperature and is also frequency dependent. The Fletcher Munson Equal-Loudness contours are a graphical representation of our sensitivity to various parts of the frequency spectrum.
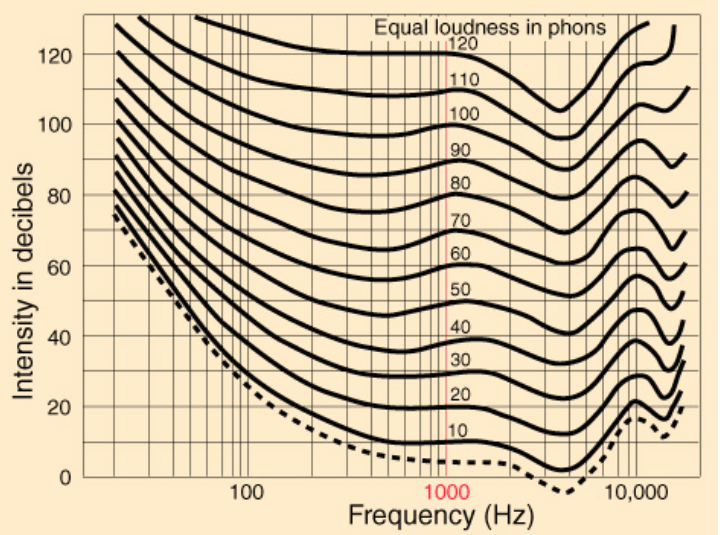
Each line represents an equal perceived loudness level at various frequencies. From these contours, compiled via extensive laboratory testing, we can deduce that we are most sensitive to frequencies between roughly 1kHz and 6kHz, and must adjust levels upward in lower and higher frequencies to attain the same perceived loudness. For example, based on the graph, in order to hear a 100Hz tone at the same level as a 1kHz tone at 20dBSPL, you would need to raise the 100Hz tone roughly 19dBSPL to 39dbSPL.
What is crucial to comprehend, is that the contours change significantly as the reference value or overall level goes up. (Sidenote: dB levels perceived at 1kHz are also referred to as Phons) The curves flatten out at higher intensities meaning that we perceive fewer differences across the spectrum at louder overall levels.
So who cares? You should and here’s why:
Let’s say you’re mixing at very loud levels and everything sounds great to your ears. Take that same mix and listen to it at a very soft level and it will sound bass-light. Likewise, mixing at very low levels will result in overbearing bass at loud levels, because of overcompensation for your lack of sensitivity in the low end at those softer levels.
So what to do? Many believe that mixing at moderate levels is a good practice, somewhere between 65 and 75dBSPL is a good place to start. Then audition your mix at various levels to see how well it translates. While many home stereo systems have a loudness control which is intended to compensate for light bass in low-level listening situations, you cannot count on your listener either having this control, knowing what it does or how to use it even if they do. Of course, if your mix is destined for the ears of a qualified Mastering Engineer, they will be well aware of these issues. But it is nonetheless crucial to understand the limits of your hearing while working so you can deliver a well-balanced mix that won’t need major adjustments.
Common Amplitude Measurements and Loudness
I am going to resist the urge to put formulas in this article based on my teaching experience and the mathematical anxiety many people needlessly impose on themselves. Instead, I have assembled a list of amplitude measurements you might come across in equipment specifications, plugins, and audio applications.
dBSPL — Sound Pressure Level with 0dBSPL representing the Threshold of Human Hearing or 20 micropascals.
dBSIL — Sound Intensity Level: power of the sound per unit of area (this is in contrast to SPL which more closely relates to the pressure affecting a microphone, for instance).
Weighted filters are used to adjust for human hearing sensitivity across the frequency spectrum and include: dBA, dBB, dBC, dBD.
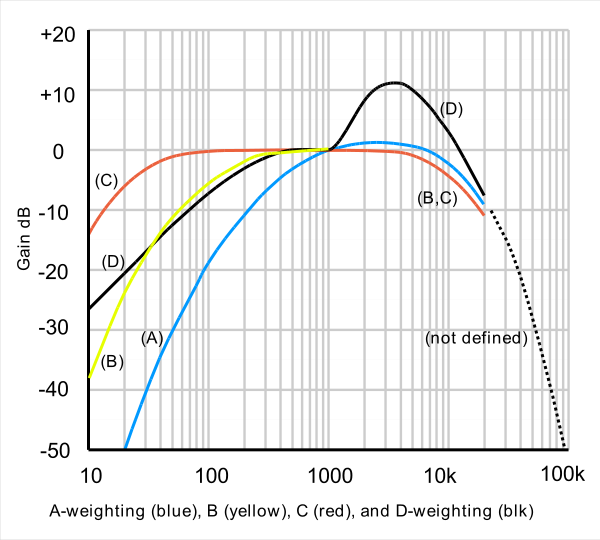
“The A-weighting curve is one of a set of four, defined in various standards relating to sound level measurement as A, B, C, and D. Curves A, B and C are for low, medium and high loudness sounds. D is specifically for measuring very loud aircraft noise.” (source)
LKFS and LUFS — Loudness K-weighted Full Scale uses K-Filtering which adjusts low frequencies to accommodate for our ears sensitivity, a method similar but not identical to A-Weighting.
dBFS — Full scale: the amplitude compared to the maximum a device or system (typically a digital system) can handle before clipping occurs. The meters on a track in a DAW always indicate the dBFS level.
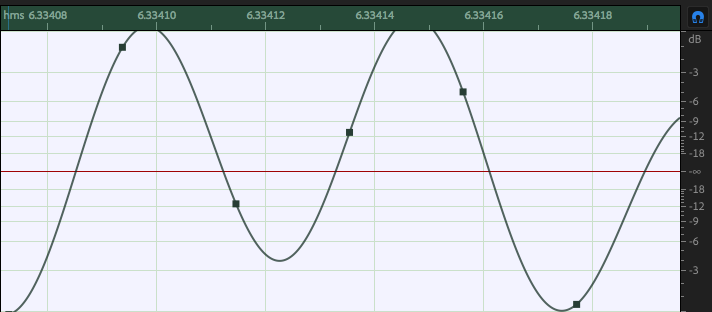
dBTP — True Peak: this measurement accounts for possible inter-sample peaks that may be present. For instance, while dBFS level might be at 0dBFS, it is still possible to have a dBTP above zero since the natural curve of the measured waveform may tend to rise above zero between samples. This is undesirable and in fact not allowable for certain deliverables, particularly in broadcast environments. Many standards define -1dBTP or less as a maximum. The example below shows a sound file with inter-sample peaks above 0dB.
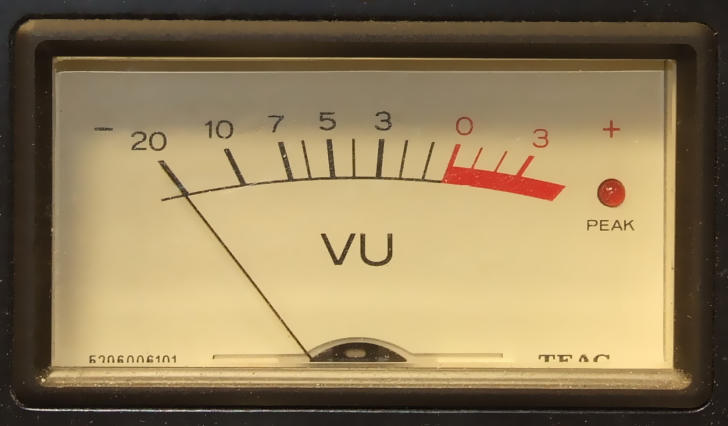
dBVU — Volume Units: this refers to analog meters which are often calibrated so that 0dBVU equals somewhere between -18dBFS to -22dBFS for a 1KHz test tone depending on how the system is calibrated.

Ready to elevate your ears?
It doesn’t have to take years to train your ears.
Get started today — and you’ll be amazed at how quickly using Quiztones for just a few minutes a day will improve your mixes, recordings, and productions!
Here’s a nice video on dBVU vs dBFS from Matthew Weiss:
https://www.youtube.com/watch?v=Djz8kaKqxyQ
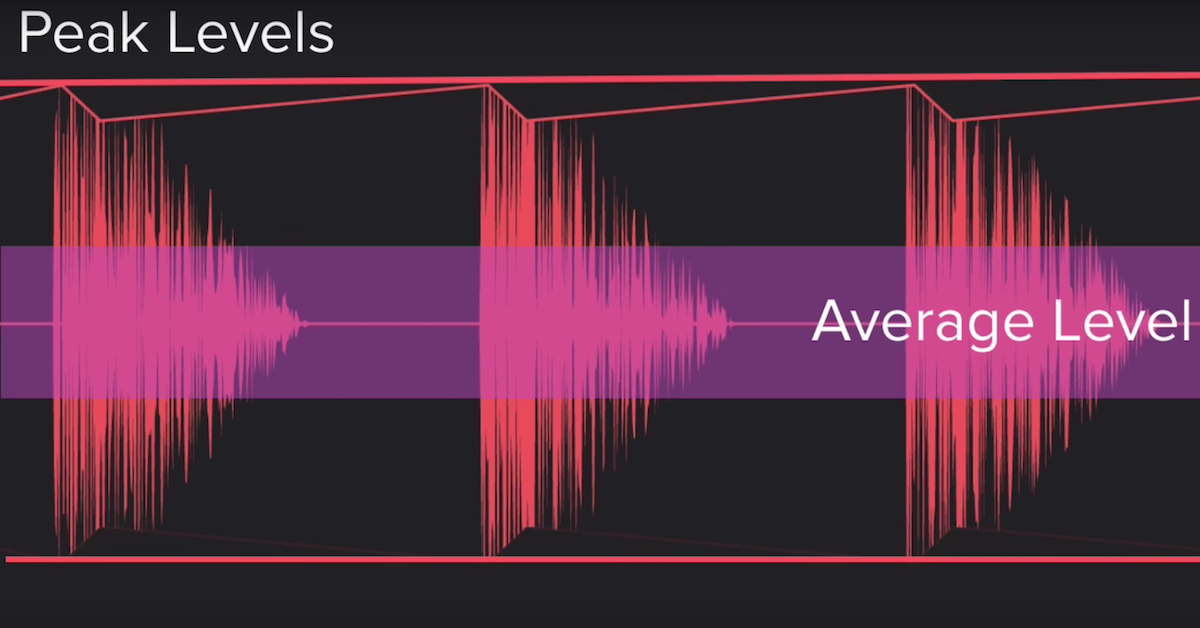
Peak Amplitude — highest instantaneous level in a waveform.
RMS Amplitude — the root mean squared amplitude — this is more of an average measurement of amplitude over time that is derived by taking many amplitude samples, squaring each value, dividing the sum by the number of samples taken, and taking the square root of the result. Hence: Root-Mean-Squared.
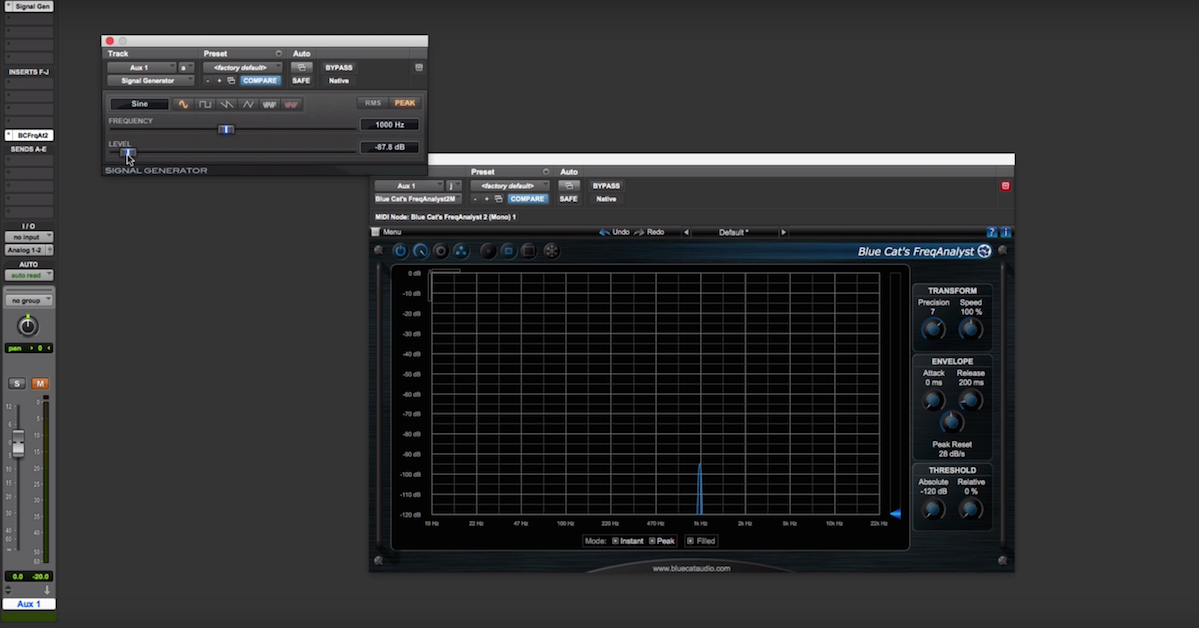
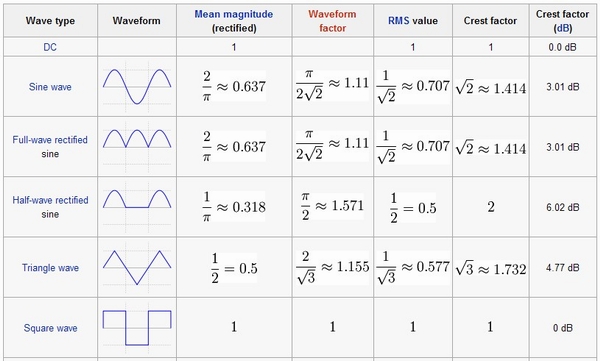
Crest Factor — the peak amplitude divided by the RMS value. So high Crest factors indicate large peaks in comparison to the RMS level and vice versa. This explains why a Sine wave sounds softer than a Square wave given equal peak amplitude values. The Square wave has an RMS Equal to its Peak amplitude whereas the RMS of a Sine wave is .707 x the Peak value. Simply put, the Square spends all its time at Peak level so sounds louder. This idea also underscores the need to consider RMS as a more relevant measure of loudness over time.
Loudness Standards
Software for controlling loudness allows for adjusting levels in terms of agreed upon loudness standards. For instance, RX Loudness Control by iZotope ships with presets for the following standards:
- AGCOM 219/09/CSP ARIB TR-B32
- ATSC A/85
- BS .1770-1
- BS .1770-2/3
- EBU R128
- EBU R128 DPP
- EBU R128 s1 – Momentary
- EBU R128 s1 – Short-term
- OP-59
These standards reflect protocols for various broadcast and other dissemination systems in Europe and around the world. For more details on these standards see the online manual for RX Loudness Control, a great resource for general information on loudness.
More computations used by iZotope among others include:
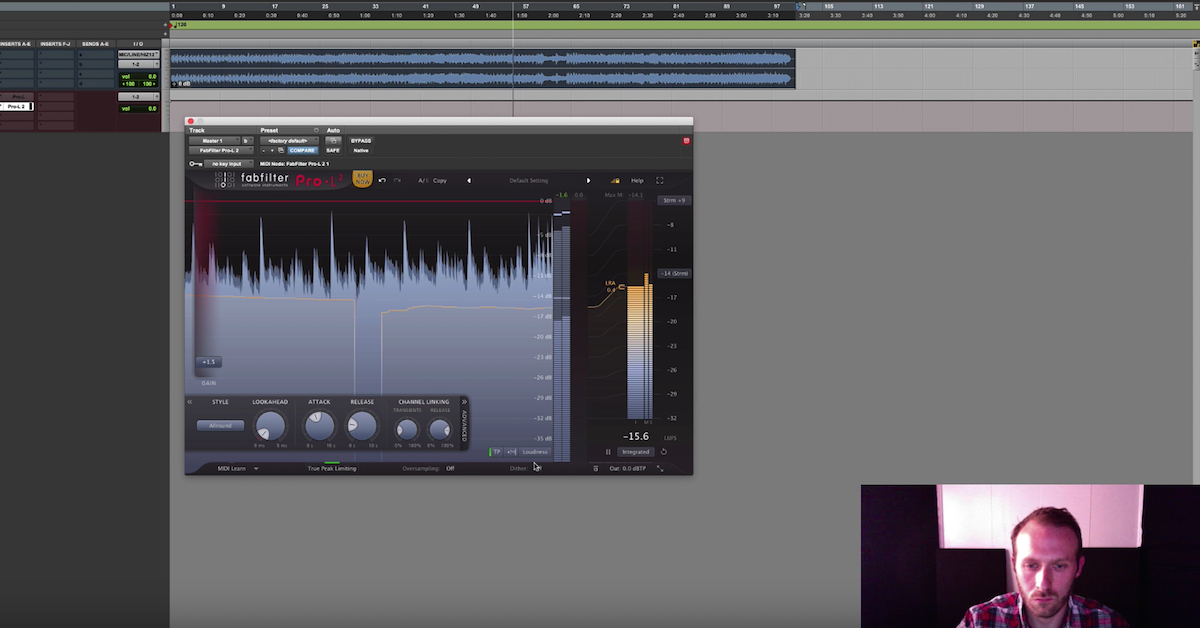
Momentary Loudness: average RMS measurements using a 400ms window
Short-term Loudness: average RMS measurements using a 3000ms window
Integrated Loudness: average RMS measurements over the entire program or length of the audio. For this type of measurement, Gating is used to exclude periods that may drop below -70 LKFS, which may cause inaccurate measurements in terms of the listener’s overall perception of the loudness.
NOTE: The so-called Loudness Wars began as artists and engineers sought to produce music at louder and louder average levels in an effort to make their material stand out. This resulted in overly squashed records with severely limited dynamic range (that being the difference between the softest and loudest sounds). Happily, many listeners, artists and engineers have advocated for a return to wider, more musical dynamic ranges. Check out this site for more about the war.
Summation
It should be obvious, if you’ve gotten this far, that amplitude and loudness are issues far more complex than at first they may appear. It is not only important to understand the basic principles and limits of human perception, but also that many loudness standards exist, and you need to know what your particular client expects in terms of deliverables and loudness specifications.
Check out my other articles, reviews and interviews
Follow me on Twitter / Instagram / YouTube
Eleveate Your Ears