4 Essential Meters for Live Sound
10/23/2014
Article Content
[This article is by Audiofile, creators of Spectre real-time analysis suite for OS X]
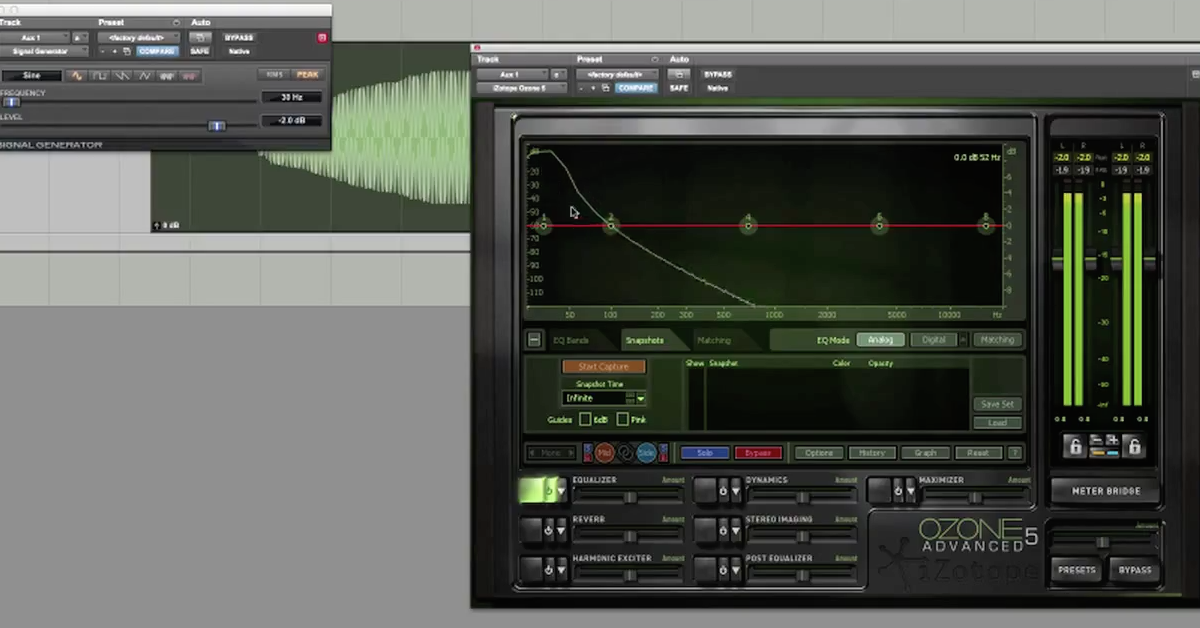
1. Spectrograph
This is, hands down, one of the most important meters you should integrate into your live system.
While there are plenty of RTA apps for your smartphone out there, a solid and accurate Spectrograph is a must. You’ll have more even mixes and can prevent listening fatigue for your audience.
What does it do?
A spectrograph measures the frequency content of the audio. Low frequencies are on the left and high frequencies on the right.
How would it help me?
Ideally, you want equal volume across the spectrum so that no one band of frequencies is particularly louder than the others. Of course, this greatly depends on the context of what you are mixing. Dance and Hip-Hop shows are obviously going to have a lot of constant low end while guitar-centric shows will have a lot of 2-4 kHz. Use this meter to help achieve that balance.
How do you know if it’s balanced?
- Use your ears
- Know what you’re looking at
Quickly, we should mention Pink Noise. Pink noise is randomly generated noise whose power or energy is inversely proportional to the frequency.
This is what pink noise looks like:
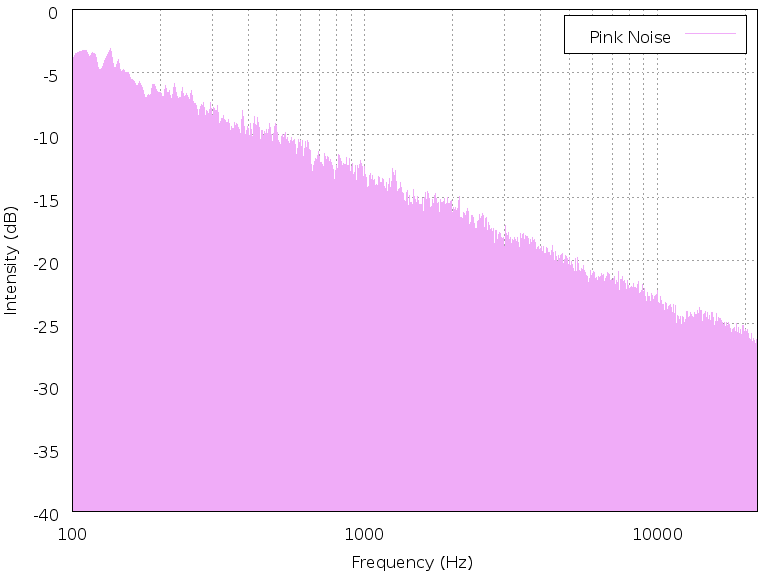
This is actually quite close to the way humans hear sound.
Recall that the Fletcher-Munson Curve tells us that lower frequencies need more energy than higher frequencies to appear to be the same volume, and vice versa.
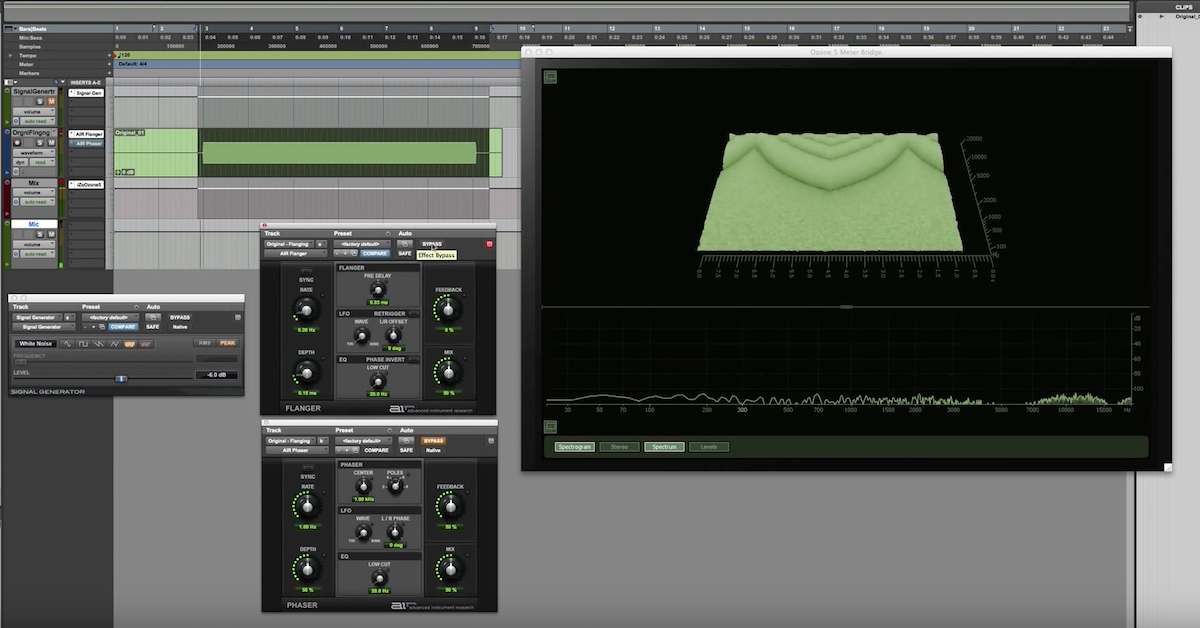
With that in mind, a pink-noise weighted spectrograph monitoring an even, spectrally balanced mix would look something like this:
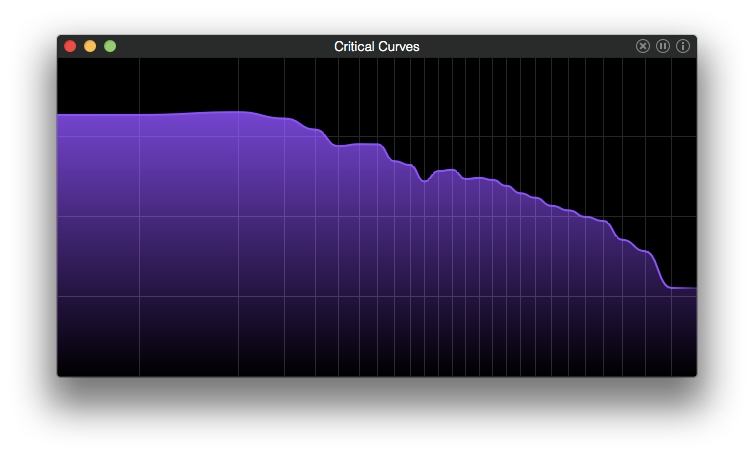
Again, how far your mix deviates from this curve greatly depends on the music you are mixing.
2. Low End
When it comes to live sound, low end can be one of the hardest things to mix properly. It’s usually either overbearing or completely lacking. I’d say that, more often, it’s the former.
What does it do?
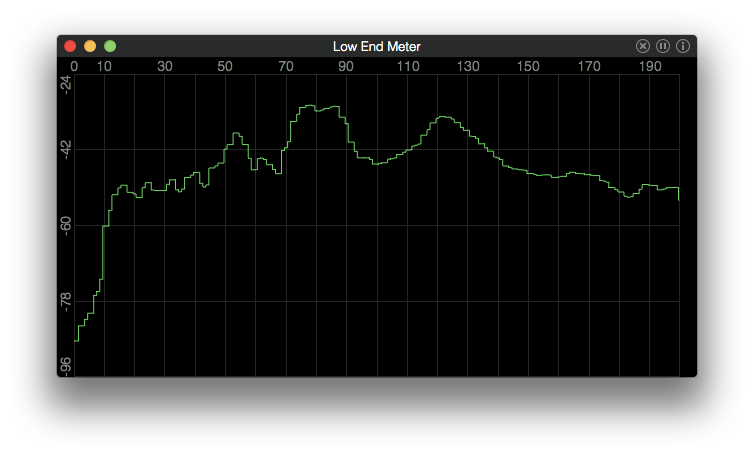
A low end meter is a specialized spectrograph that measures frequencies generally below 200 Hz at 1 Hz intervals.
How would it help me?
While a typical spectrograph gives a great overview of the entire spectrum, it’s very useful to be able to zoom in to particular areas such as the low end to see what frequencies are peaking.
You’re probably able to hear these, but singling out sub 100 Hz frequencies can be tough to do by ear.
3. Lissajous
Any engineer mixing on a stereo system should be checking the stereo balance and this meter is indispensable for doing just that.
What does it do?
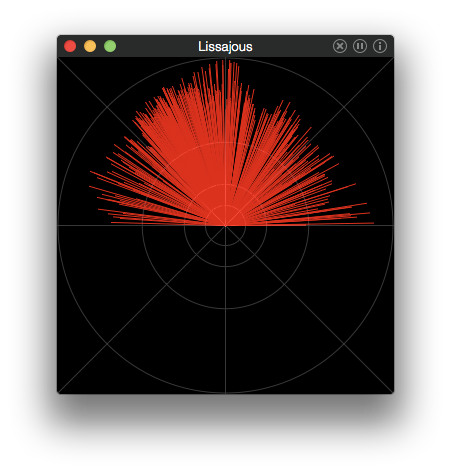
The Lissajous meter measures the coherence between two signals. Two completely coherent signals would create a single vertical line in the meter signifying that the signals are identical or mono. All differences between the signals are what creates the visualized image of the field.

Ready to elevate your ears?
It doesn’t have to take years to train your ears.
Get started today — and you’ll be amazed at how quickly using Quiztones for just a few minutes a day will improve your mixes, recordings, and productions!
How would it help me?
An unbalanced mix will cause the stereo field to appear shifted farther left or right, which means some of your audience may be hearing more or less, depending on where they are in the venue.
Of course, in live sound, audience position varies wildly, so you’ll probably want to keep your mix closer to mono. There are plenty of other variables at play here, but cleaning up your stereo image goes a long way to a great mix.
4. Compare Spectra
If you’re interested in what your live rig is actually doing to your audio and what’s changing between the source and the output, then this meter is worth a look.
What does it do?
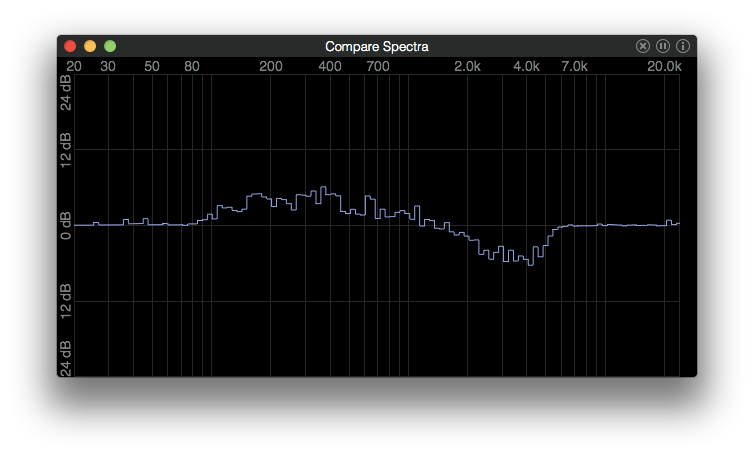
Comparing spectra compares the frequency response of two signals over time.
The center line is 0 dB. If the level at a frequency appears higher, it means there is more power from the first channel. If it appears lower, there is more power from the second channel.
How would it help me?
Send some source audio to one channel of the meter, then set up a reference mic and send it to the second channel of the meter. Get the source and reference mic volumes (to the meter) to be as close to equal as possible and you’ll quickly identify what frequencies are being boosted or cut between the source and your live rig.
Bonus: Coherence
In the same way that we set up a source and reference for the Compare Spectra meter, we can see how phase is affected with respect to frequency between source and output.
A Coherence meter compares the phase of two signals over time with respect to frequency. If coherence is high (1) it means that the frequency is in phase between the two signals. If coherence is low (0), the frequency is most out of phase between the two signals.
It’s important to note that you’ll need to set up a delay for the mic signal. Audiofile’s free Audiofile Calc app can convert distance to time for you.
Eleveate Your Ears