Intro to Frequency Analysis with iZotope Ozone 5
03/23/2014

Now if you’re recording into a digital audio workstation, chances are that what you see displayed onto the screen when you finish recording is called a signal’s waveform. The waveform represents the amplitude of the signal versus time.
You might have also heard other names for the waveform, things like the time domain representation of the signal, or the temporal analysis of the signal. But they all mean the same thing. In many cases this is a very helpful way to visualize exactly the signal that you’ve recorded. Nonetheless, there are certain circumstances when you’re recording and mixing where you might want to consider other ways of visualizing your signal.
Another example of this would be what’s called the frequency spectrum of a signal or the spectral analysis of the signal. The idea for this goes back to a french mathematician from the late 1700’s and early 1800’s named Joseph Fourier. He came up with the idea that many of the complex signals that we encounter and deal with in the real world can actually be represented as the summation of individual frequencies.
I think this is intuitive for those of us that have been around audio for a little while because we’re used to working with signals that might have bass frequencies or low frequencies at the same time as high frequencies and treble frequencies. You know, we have complex signals that have things like harmonics and overtones, which are basically just individual frequencies that occur at the same time.
So he used his idea to actually one up with a different way of representing a signal. Rather than amplitude vs time, he looked at the amplitude of these individual frequencies as gonna be adding together. Therefor amplitude vs frequency.
For those of us that are working in a digital audio workstation there are some great tools already available that we can make use of to analyze our signal in this way.
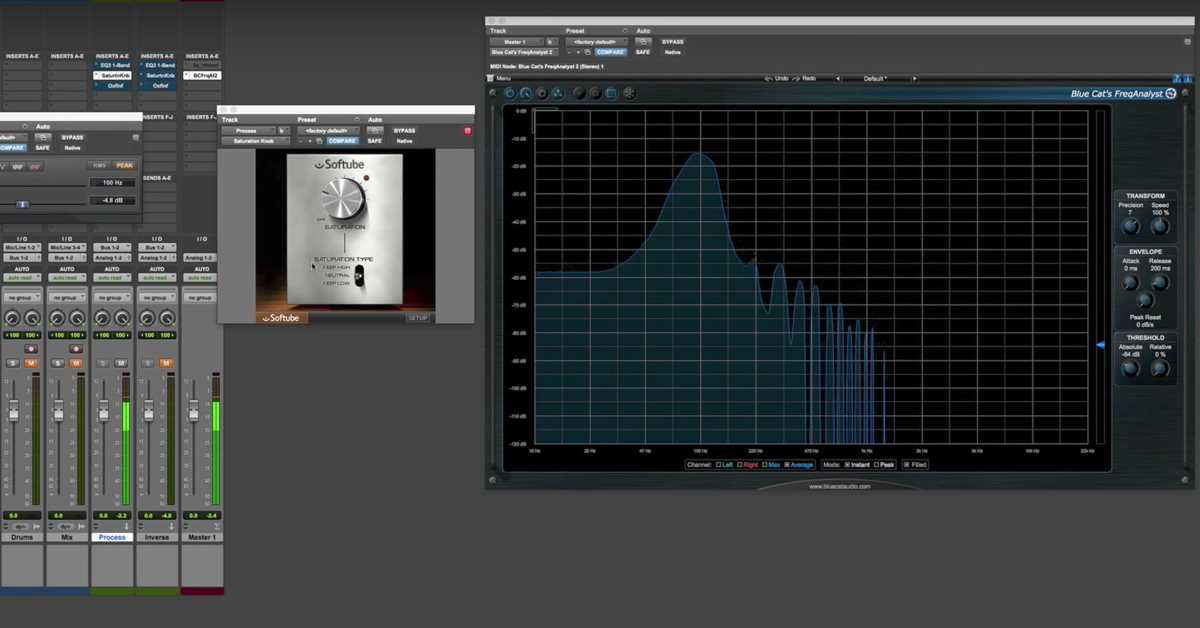
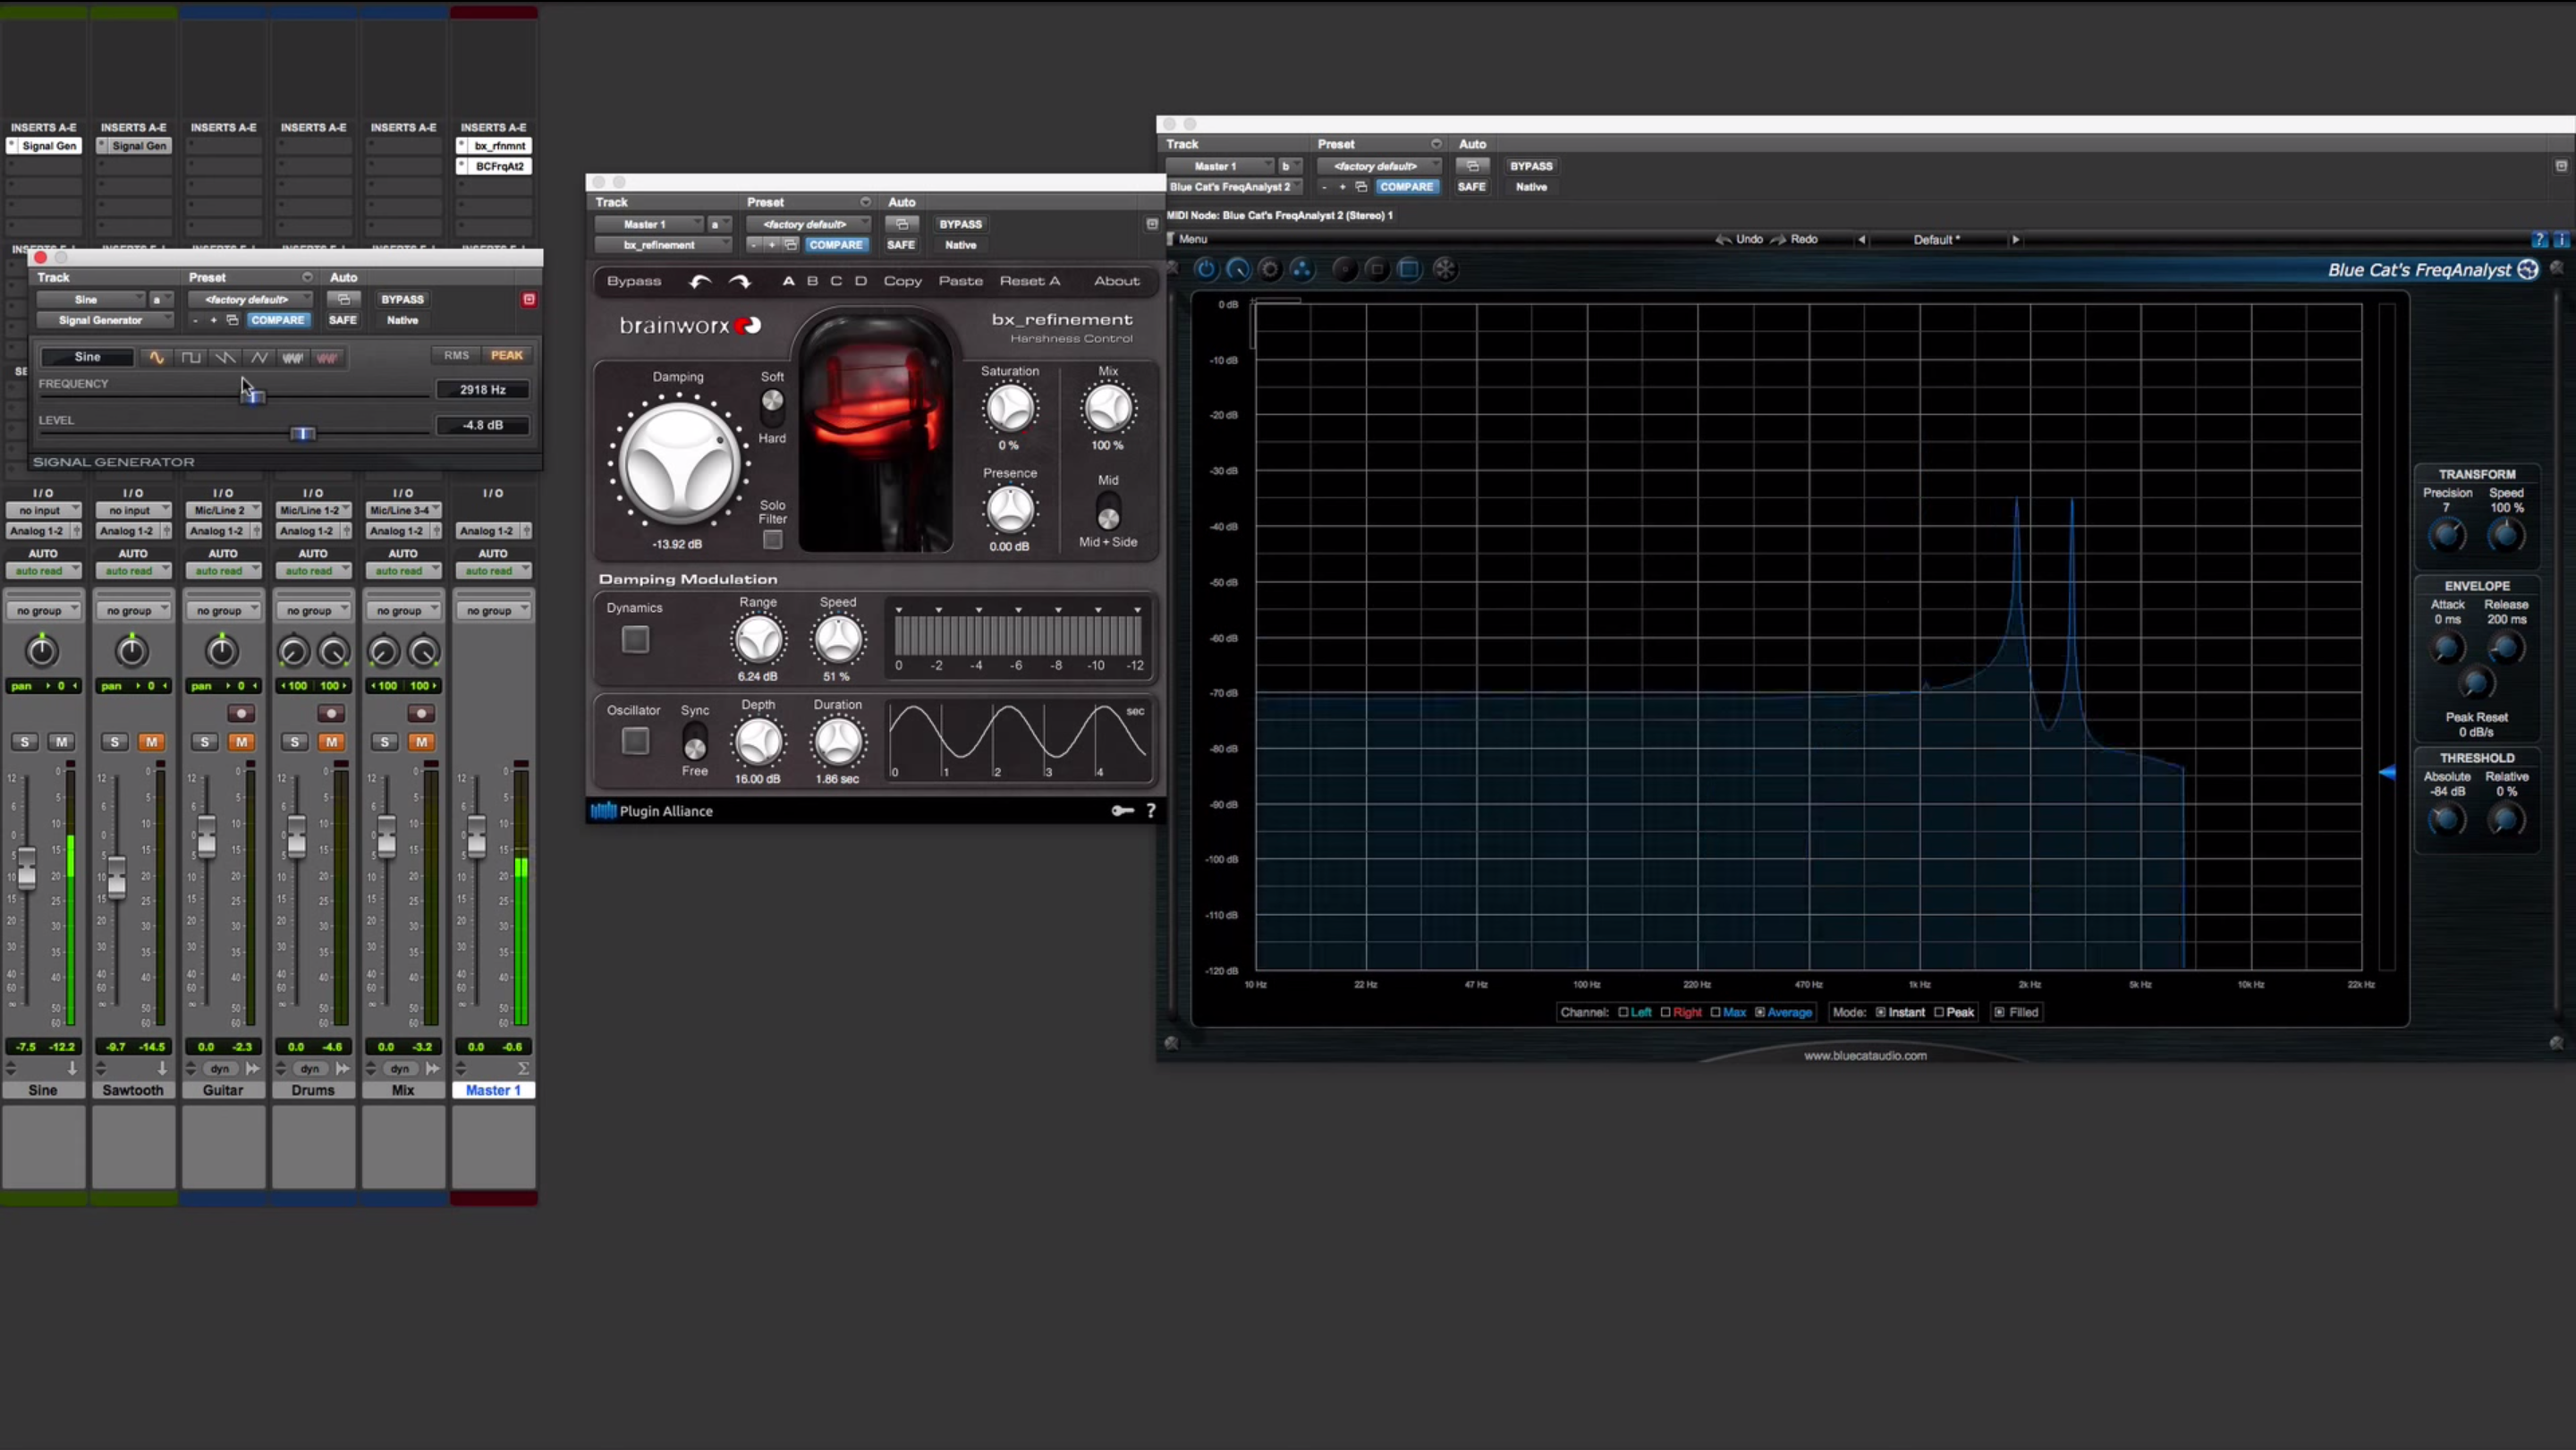
I’m gonna go ahead and bring up iZotope Ozone. This is a plugin that has many different processors inside. I’m gonna be using the equalizer because in the graphical user interface, it will display the frequency spectrum of a signal.
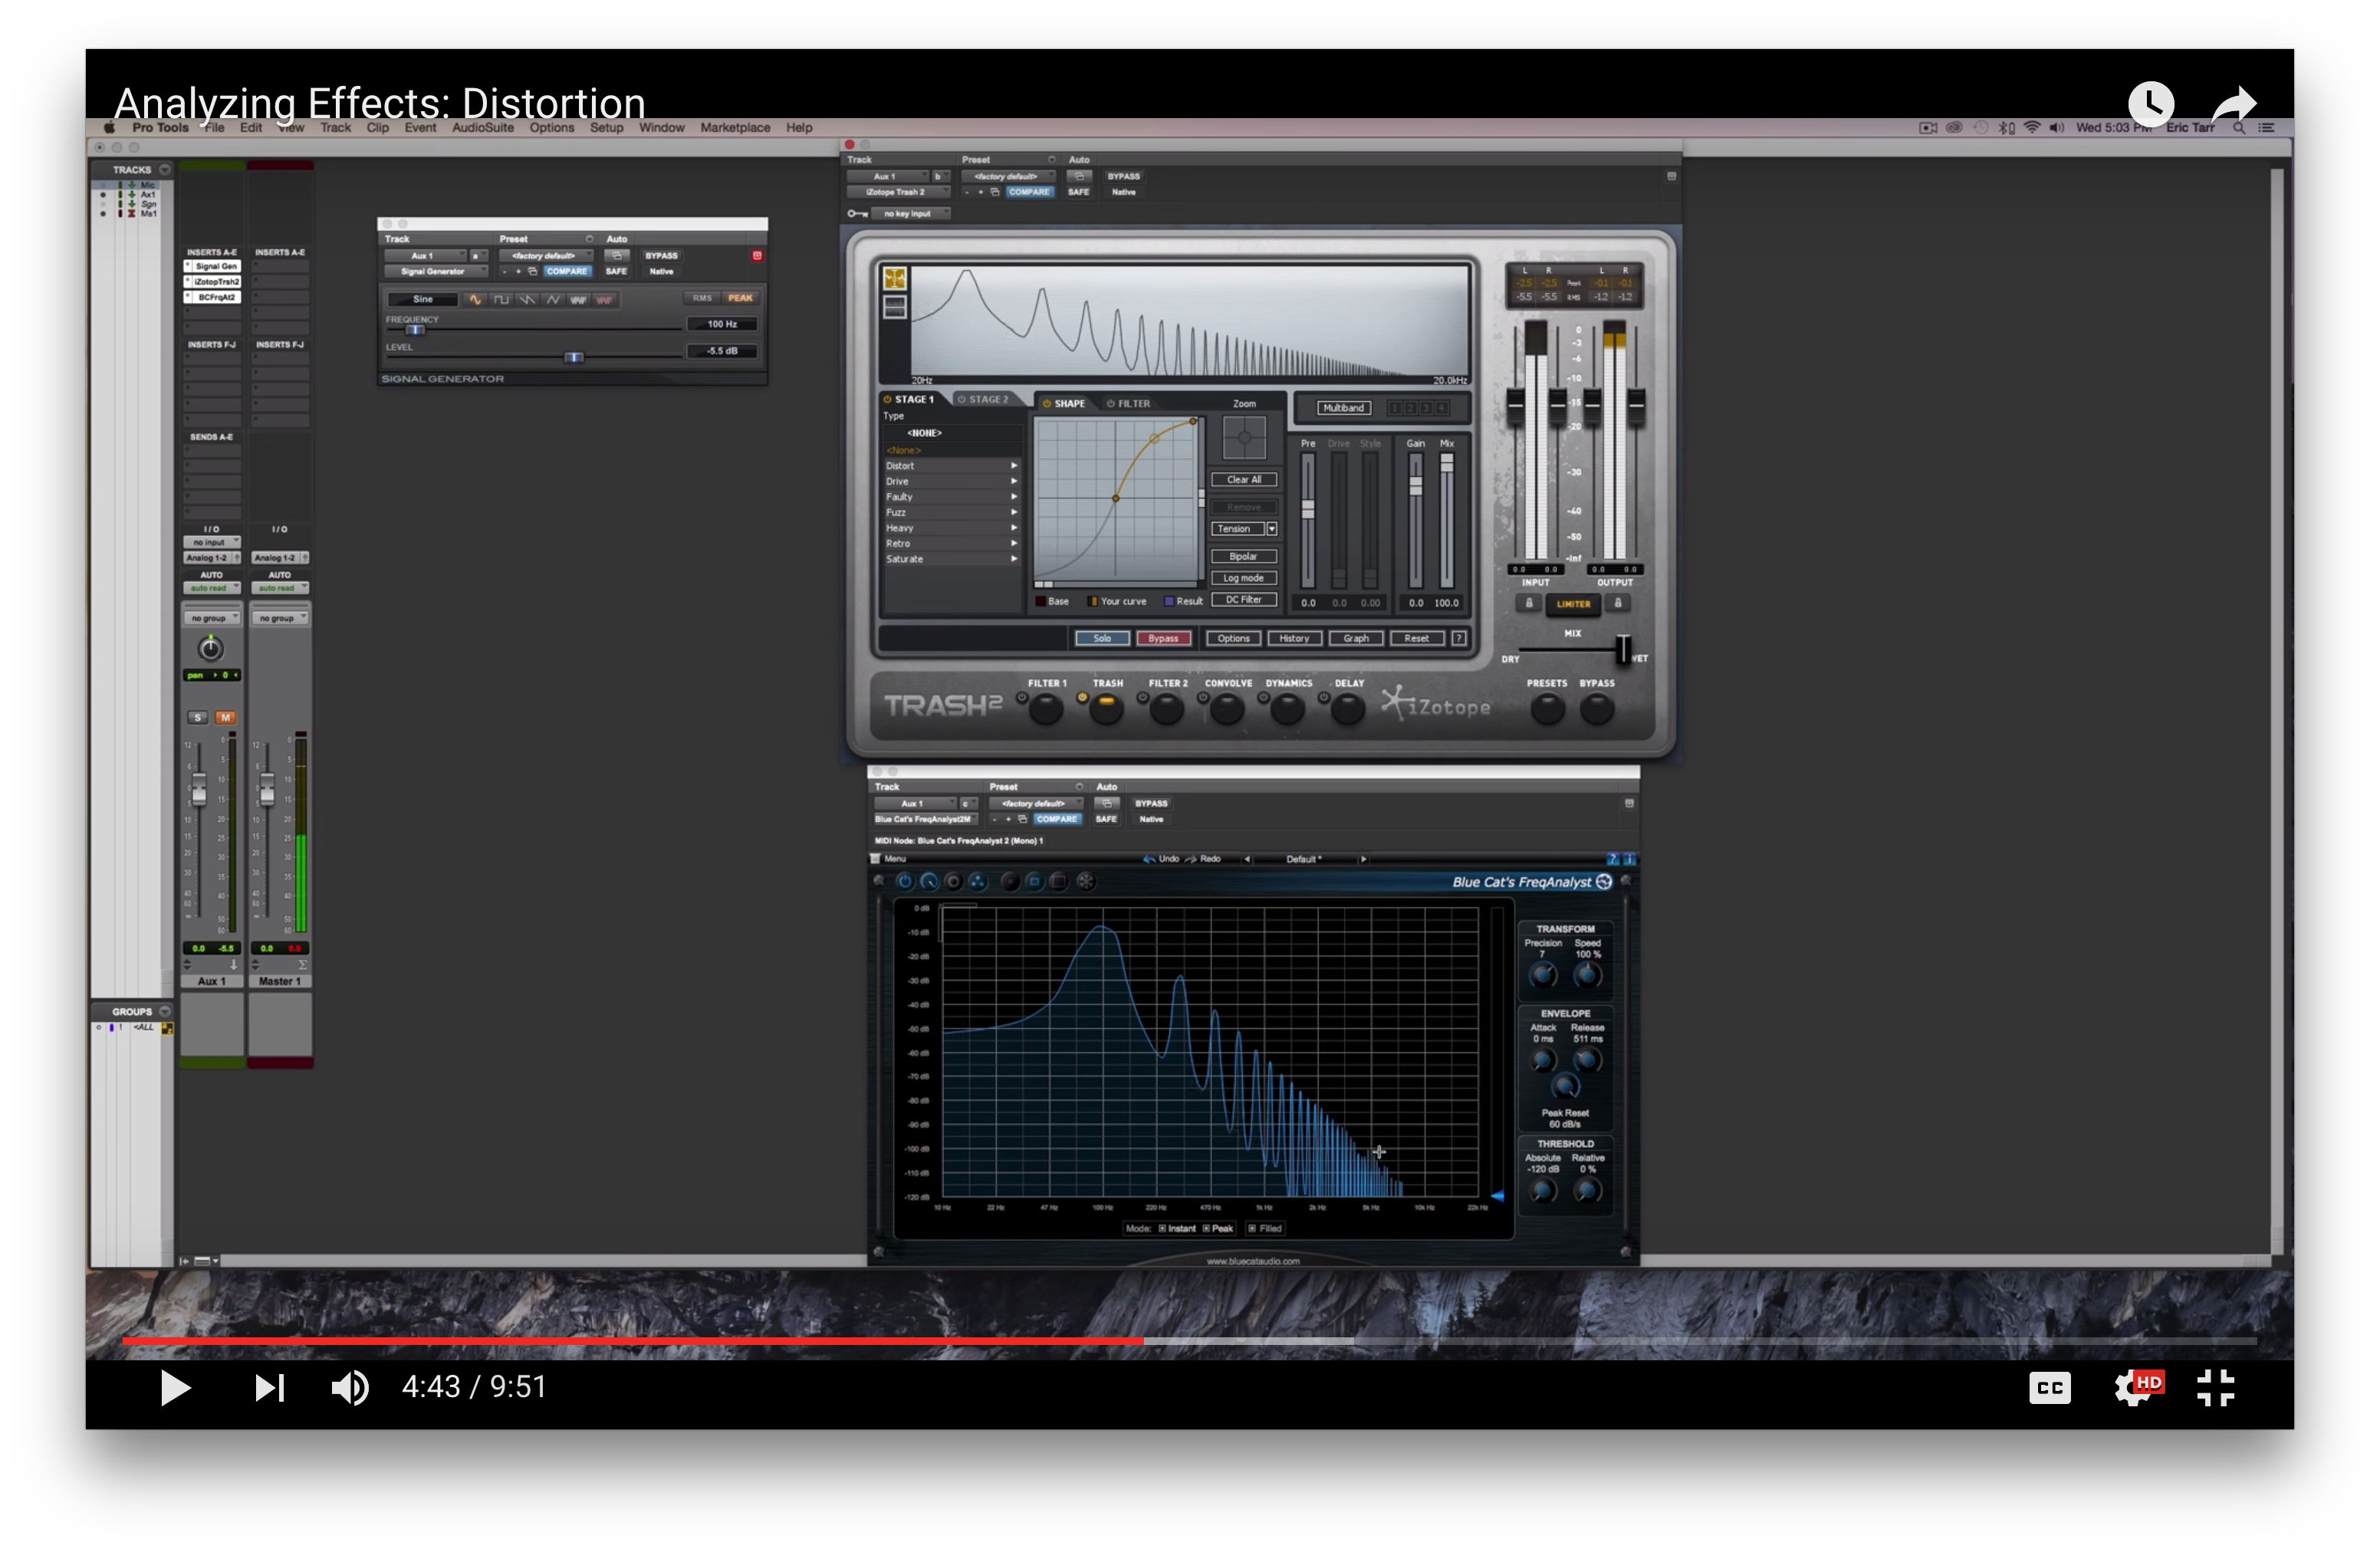
Now the signal that I’ve got going right now and feeding into iZotope Ozone is a 30 Hz sine wave. This is an individual frequency where the pattern of amplitude repeats 30 times every second. And that’s what I mean by 30 cycles per second, or 30 Hz. So you’ll see I’ll play it back and the amplitude will ramp on. You’ll see what happens is most of the energy in my signal is down here in 30 Hz.
[30 Hz signal]
Now if you couldn’t really hear that because of your speakers or headphones, don’t worry. What I’m actually gonna do is bring up my signal generator and Pro Tools, mute this because I know it can get annoying. Let’s bring up my signal generator and another instance of iZotope Ozone. I’ve already got the signal generator going on this channel. Here’s my signal generator coming up with my 30 Hz sine wave, and has energy in the frequency spectrum down here. As I increase that frequency, you can see what happens to my signal. Now I’m up near 1000 hertz. Now i’m at around 5000 hertz. And you can see that it just has energy in the frequency spectrum around where my frequency is here.
What I’m gonna do then, is switch my signal generator from a sine wave to some more complex signals. The first one I’ll switch to is what’s called a square wave. It looks like this, if you look at the wave form, it just has the amplitude that switches from one amplitude to another one over time. What does this actually look like in the frequency domain then? A sine wave just has a single spike at that particular frequency — let’s look at the square wave. Why don’t I start at a lower frequency to begin with. Let the frequency analyzer deal with the signal and what you’ll see is that there’s harmonics at particular frequencies. So if I pick a good one like 100 Hz I’ve got a harmonic at 100 Hz and I’ve got a harmonic at 300 Hz, and then 500 Hz, 700 Hz, or odd harmonics. You can see that the square wave then is comprised of the summation of these individual frequencies.
Same thing if I switch over to a triangle wave. You see that the harmonics are actually at the same frequencies, the difference is actually the amplitude of those frequencies. So, looking at the triangle wave here vs the square wave, the harmonics are at the same frequencies, they’re just at different levels. And that’s how you can come up with these different complex signals.
Next I’ll switch over to the sawtooth wave. You’ll see that the different between this one and the other signals I’ve looked at so far, is you actually have frequencies at the even harmonics: 100 Hz, 200 Hz, 300 Hz, and so on. All the way up the frequency spectrum.
So, play around with this you guys. Check it out for yourself. Consider other signals that you can put in. Not just these that come from the signal generator. Look at voice, look at piano, look at drums and all those things. And you can see that it’s comprised of these individual frequencies that are just being added together.
So, thanks for checking out the video and catch you guys soon.
Elevate Your Ears