Analyzing Effects: Distortion
06/20/2016

I’ve got a video for you all about distortion, or saturation, clipping, rectification, fuzz, overdrive, all of these different ways that we add harmonic distortion to our signal when we’re working with audio.
I’m going to be primarily working with this plug-in from iZotope called Trash 2. It’s a very versatile plug-in, but I’m going to be focusing on just the Trash module. The distortion part of the plug-in.
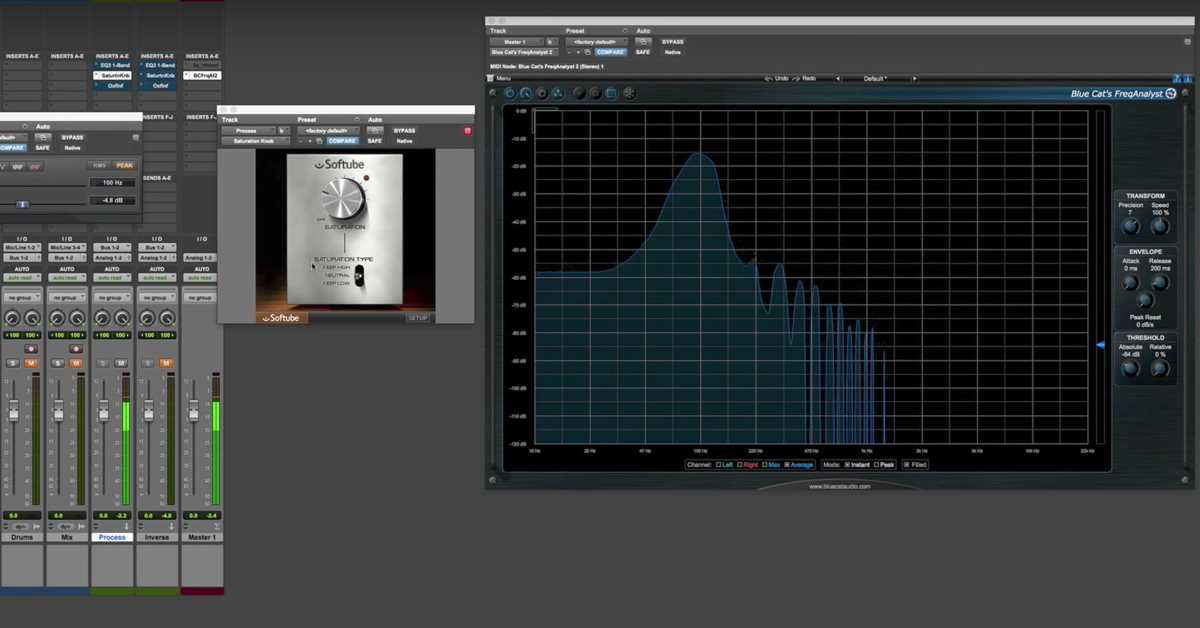
I’m going to be analyzing what’s taking place here. I’m going to be analyzing it, specifically by using this signal chain. I’ve got a signal generator plug-in, synthesizing a 100Hz tone. I’m going to send that signal through the plug-in and analyze the output.
So down here I’ve got the Blue Cat frequency spectrum analyzer. The reason why I’m using this one is because the horizontal axis has a scale. Up here, we have a spectrum analyzer, but we can’t really see exactly what frequencies are being created in the same way that we can by using this one down here.
This is a free plug-in. I highly recommend you checking it out.
So if I were to come up here to my signal generator, I can change the frequency, and like this, I’m sure you all have heard different kinds of frequencies, but I’ll let you hear them really quickly.
[sine wave]
But that will get annoying pretty quickly, so I’ll just go ahead and mute it for the rest of the time.
I’m going to analyze here what’s going on. One thing that’s really cool about the Trash module, why I’m using it, is that it has this interesting display here. What it’s doing is it’s plotting for us the relationship between the amplitude of our input signal, that’s our sine wave, and that’s happening on the horizontal axis, and that we’re plotting it against the amplitude of our output signal that’s on the vertical axis.
So what’s happening is our sine wave, you can think of it like this. Our sine wave is oscillating back and forth. Increasing in amplitude over here, then decreasing in amplitude going negative. We have a positive and negative part of our cycle.
So our input amplitude is increasing, and then going negative. Right? And what this plot is showing us, this point along this line right here is what is the amplitude of the input compared to the amplitude of the output? As our input amplitude goes up, this line is saying our output amplitude also goes up by the exact same amount. So right now we have a linear relationship — a straight line between our input and our output. When we start to distort our signal, that’s when we go away from this straight line.
So as an example, let me create one kind of distortion effect. One example is hard clipping. So hard clipping shows up in audio sometimes with like, a transistor or digital clipping where we reach some point where we say that’s a maximum level that the signal can reach.
So our input signal is going to go up like this, but we reach some point at our output where we say our output can’t go above this. This is the maximum level our output can be.
So what happens is our output goes up, and then it gets saturated, and then it stops, and then it goes back down, and then it gets saturated down here as well.
So whenever the signal goes above, that’s when we have the distortion starting to happen. So what do we start to see now? When the signal is going above and clipping in this region here, we end up with some harmonics. These harmonics show up across our spectrum.
So we’ve got here our fundamental, or our original signal. That harmonic is at 100Hz. We can look at and see, alright, the harmonics that start to show up, we’ve got 300Hz, 500Hz, 700Hz, those are odd harmonics that show up across the spectrum.
So that’s what we can anticipate what’s going to happen when we start to use hard clipping. Right? The more we start to saturate it, the level comes down here, harmonics get louder, right? Relationship between the fundamental, or the lowest harmonic, and the other ones changes depending on how much we start to clip it.
So let me show you another kind of saturation, or distortion. So let me clear this out and we’re going to switch from hard clipping over to soft clipping. So soft clipping is maybe more what you would anticipate to see if you were coming across a vacuum tube. So soft clipping is going to have something like this. It’s much more of a smooth curve, rather than an abrupt thing where it gets cut off.
So we’ve got now a smooth curve with the relationship between our input and our output. What happens? We still have odd harmonics. 100, 300, 500, 700, all the way up. Just a different amplitude, a relative amplitude between these harmonics, right? The more we distort it like this, we’re going to end up with different kinds of harmonics.
What I want you to see is we’re still ending up with these odd kind of shapes. So let me go back to the linear relationship. So we’ve got just our fundamental harmonic right here. What I’m going to do is turn on this one right here, bipolar. What that means is that now instead of having this symmetry up here for the positive and negative parts, I’m going to have independent control of what’s going on from one to the other.
So another example of distortion that we come across in audio is one called rectification. Specifically, half wave rectification. Half wave rectification would look like this. It’s what would happen if a diode, and electronic circuit component, were to saturate. It cuts off the negative part, but let’s the positive pass through.
Another example of this would be full wave rectification. This is when all of the negative parts become the positive parts. So what’s happening? Our input signal goes up, and our output signal is positive here. Our input signal goes down along the horizontal axis, but what is our output signal? Our output signal is also positive.
So no matter what, you may have learned about this in a math class before, something called the absolute value function. Right? This looks like our absolute value.
So some of this things you probably learned about before in math class are actually very useful, and we use them all of the time in audio.
So here, our input signal and output signal is always going to be positive. Let’s have a look at, then, what happens to the harmonics when we have this kind of thing.
So here, our fundamental is now gone. It used to be at 100Hz, but now we’ve got harmonics at 200, 400, 600, 800. We have now the even harmonics here instead of odd ones.
So we have a different kind of distortion. We have different kinds of harmonics. We can go back here to the diode kind of thing and look at the difference.
So half wave rectification, this is when we have our fundamental here. So that’s the difference between what we just looked at. Fundamental and then the even harmonics that show up.
So different kinds of distortion will give us different harmonic content, and there’s all kinds of examples of things we can look at. I can start to distort these things and change this one. We can come up with all kinds of different shapes and end up with different harmonics that show up here.
So in this case, this arbitrary one that I came up with has some soft clipping to it. It’s asymmetrical, it has both even and odd harmonics. So another thing that you might remember from math class, a long time ago, or maybe you don’t remember this from math class, like in algebra class, you learned about different kinds of functions. Your teacher told you that you can categorize functions into several different types.
One special type of function is called an “even” function, and another kind of function is called an “odd” function.
So guess what? We can relate those name to the kinds of harmonics that show up. So let me clear this off again.
If you remember, or don’t remember, there was a kind of function called an even function. And even function was when the shape was symmetrical across this vertical, or Y-axis. When it’s symmetrical across here, no matter the shape, we’re going to end up with even harmonics. This is an even function.
So I can distort this, distort this one, this kind of thing, we’re going to end up with even harmonics because it’s symmetrical across this axis.
But if we go to an odd function, instead of being symmetrical across the Y-axis, we have some symmetry now that shows up — this is the top right part of the graph, or quadrant, this is called the first quadrant, and this one down here at the bottom left part of the function, this is called the third quadrant.
We have this circular symmetry, where what’s going on up here is also going down here. So your math teacher probably told you, this is called an odd function.
You probably asked, “Why do I have to learn about these different kinds of functions? Why does that matter at all?” Or maybe you weren’t even paying attention like me. I had to learn this after the fact.
But we have in this case, an odd function, and we have odd harmonics that show up. So now, these are terms and things that we have maybe come across before that have direct applications to thing that we come across in audio. So certainly, there’s all kinds of different things that you can play around with and understand by using this kind of visualization.
So that’s all I’ve got for you here. Hopefully you learned some things and made some more connections about stuff you’ve probably come across before.
So anyways, until next time, take care, guys.
Elevate Your Ears