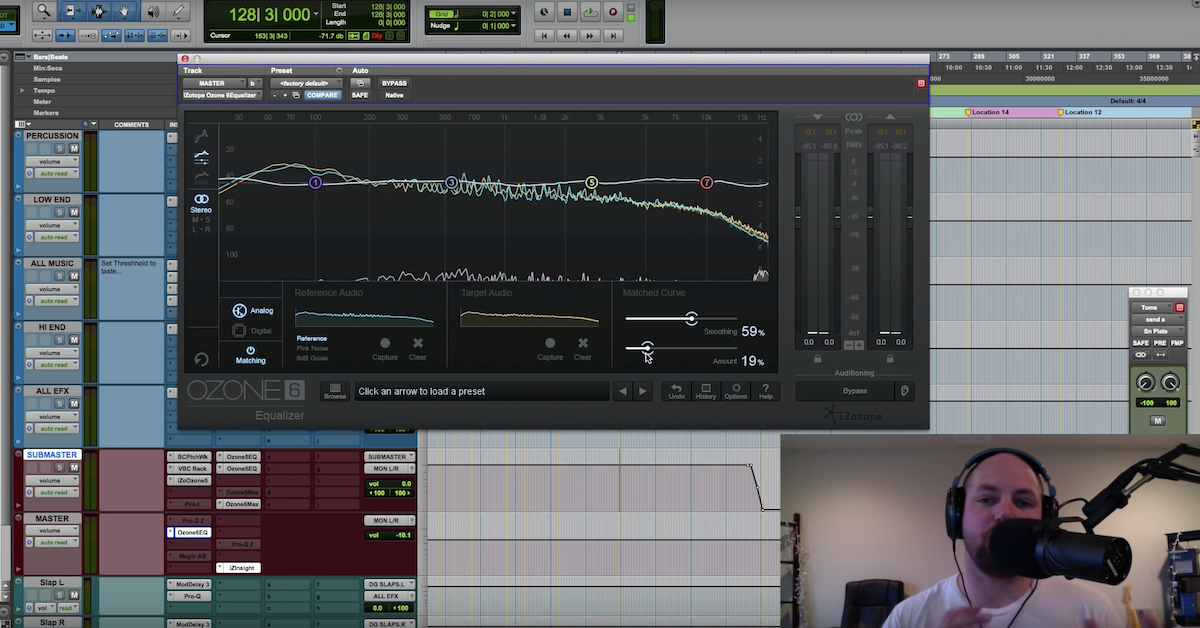
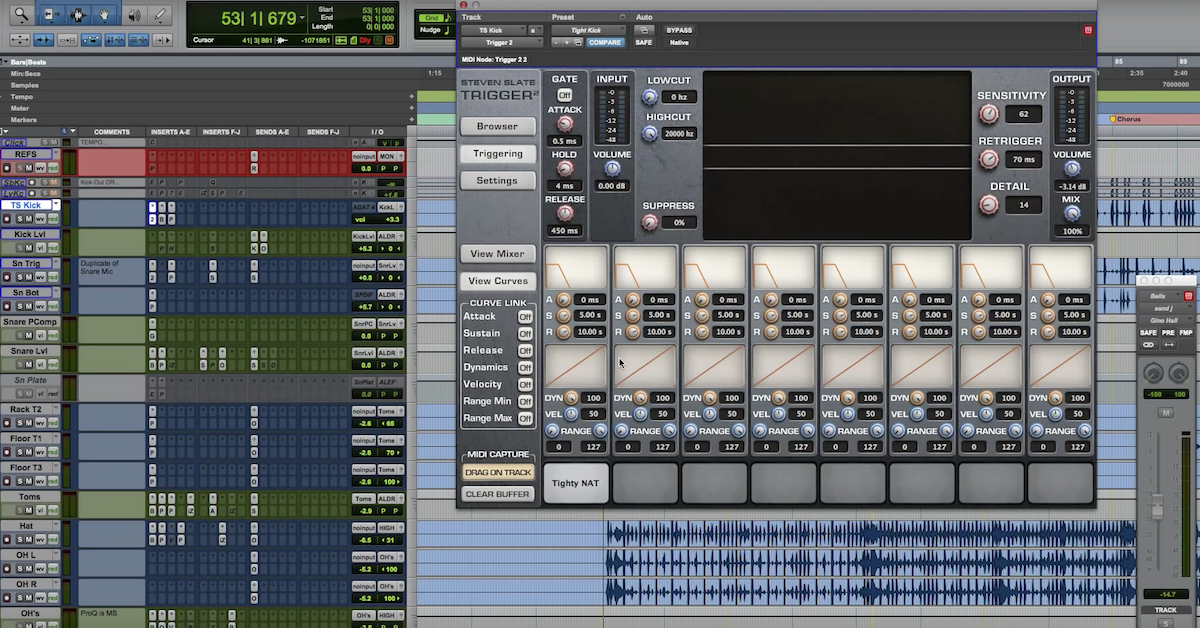
Reference 4 Frequency Curve Graph Overview
In this video, I’m going to tell you a bit about each graph. Simulated after is the actual frequency response that you are getting after the correction is applied to your system. In an ideal world, the after curve would coincide with the target curve, however, depending on the capability of your speakers or headphones, the correction limits settings, and the filter phase type setting, the after curve could differ from the intended target curve.
Before is the initial perceived acoustic frequency response of your speakers or headphones as measured by the Sonarworks calibration software. This is the frequency response you hear when Reference 4 is bypassed.
Correction is the signal frequency response currently being applied to your system. The correction curve is a mirror of the before curve, relative to the currently selected target curve.
Filter phase is the change of the signal response introduced by the Reference plugin. It changes depending on the specific correction profile being applied in the filter phase type setting. Filter phase is measured in degrees, and it is displayed in the secondary y-axis.
Limits shows the limits applied to the correction curve to protect your speakers or headphones from excessive boosts beyond the capability of the driver. You can see and adjust the filter limit settings in the limit control settings section of the Reference plugin.
Target is the current selection of the target frequency response you wish to calibrate your system towards. This can be altered by using the bass boost and tilt options, as well as the predefined target curves.
Those are the available frequency curve graphs inside of Reference 4.
FREE Masterclass: Low-End Mixing Secrets
Downloaded Over 19,455 times!
Discover how to make your kick and bass hit hard by cutting (NOT boosting) the right frequencies! Plus, more counterintuitive ways to get fuller yet controlled low-end in your mix. Download this 40-minute workshop by Matthew Weiss, now for FREE!